What is OpenAI Charts?
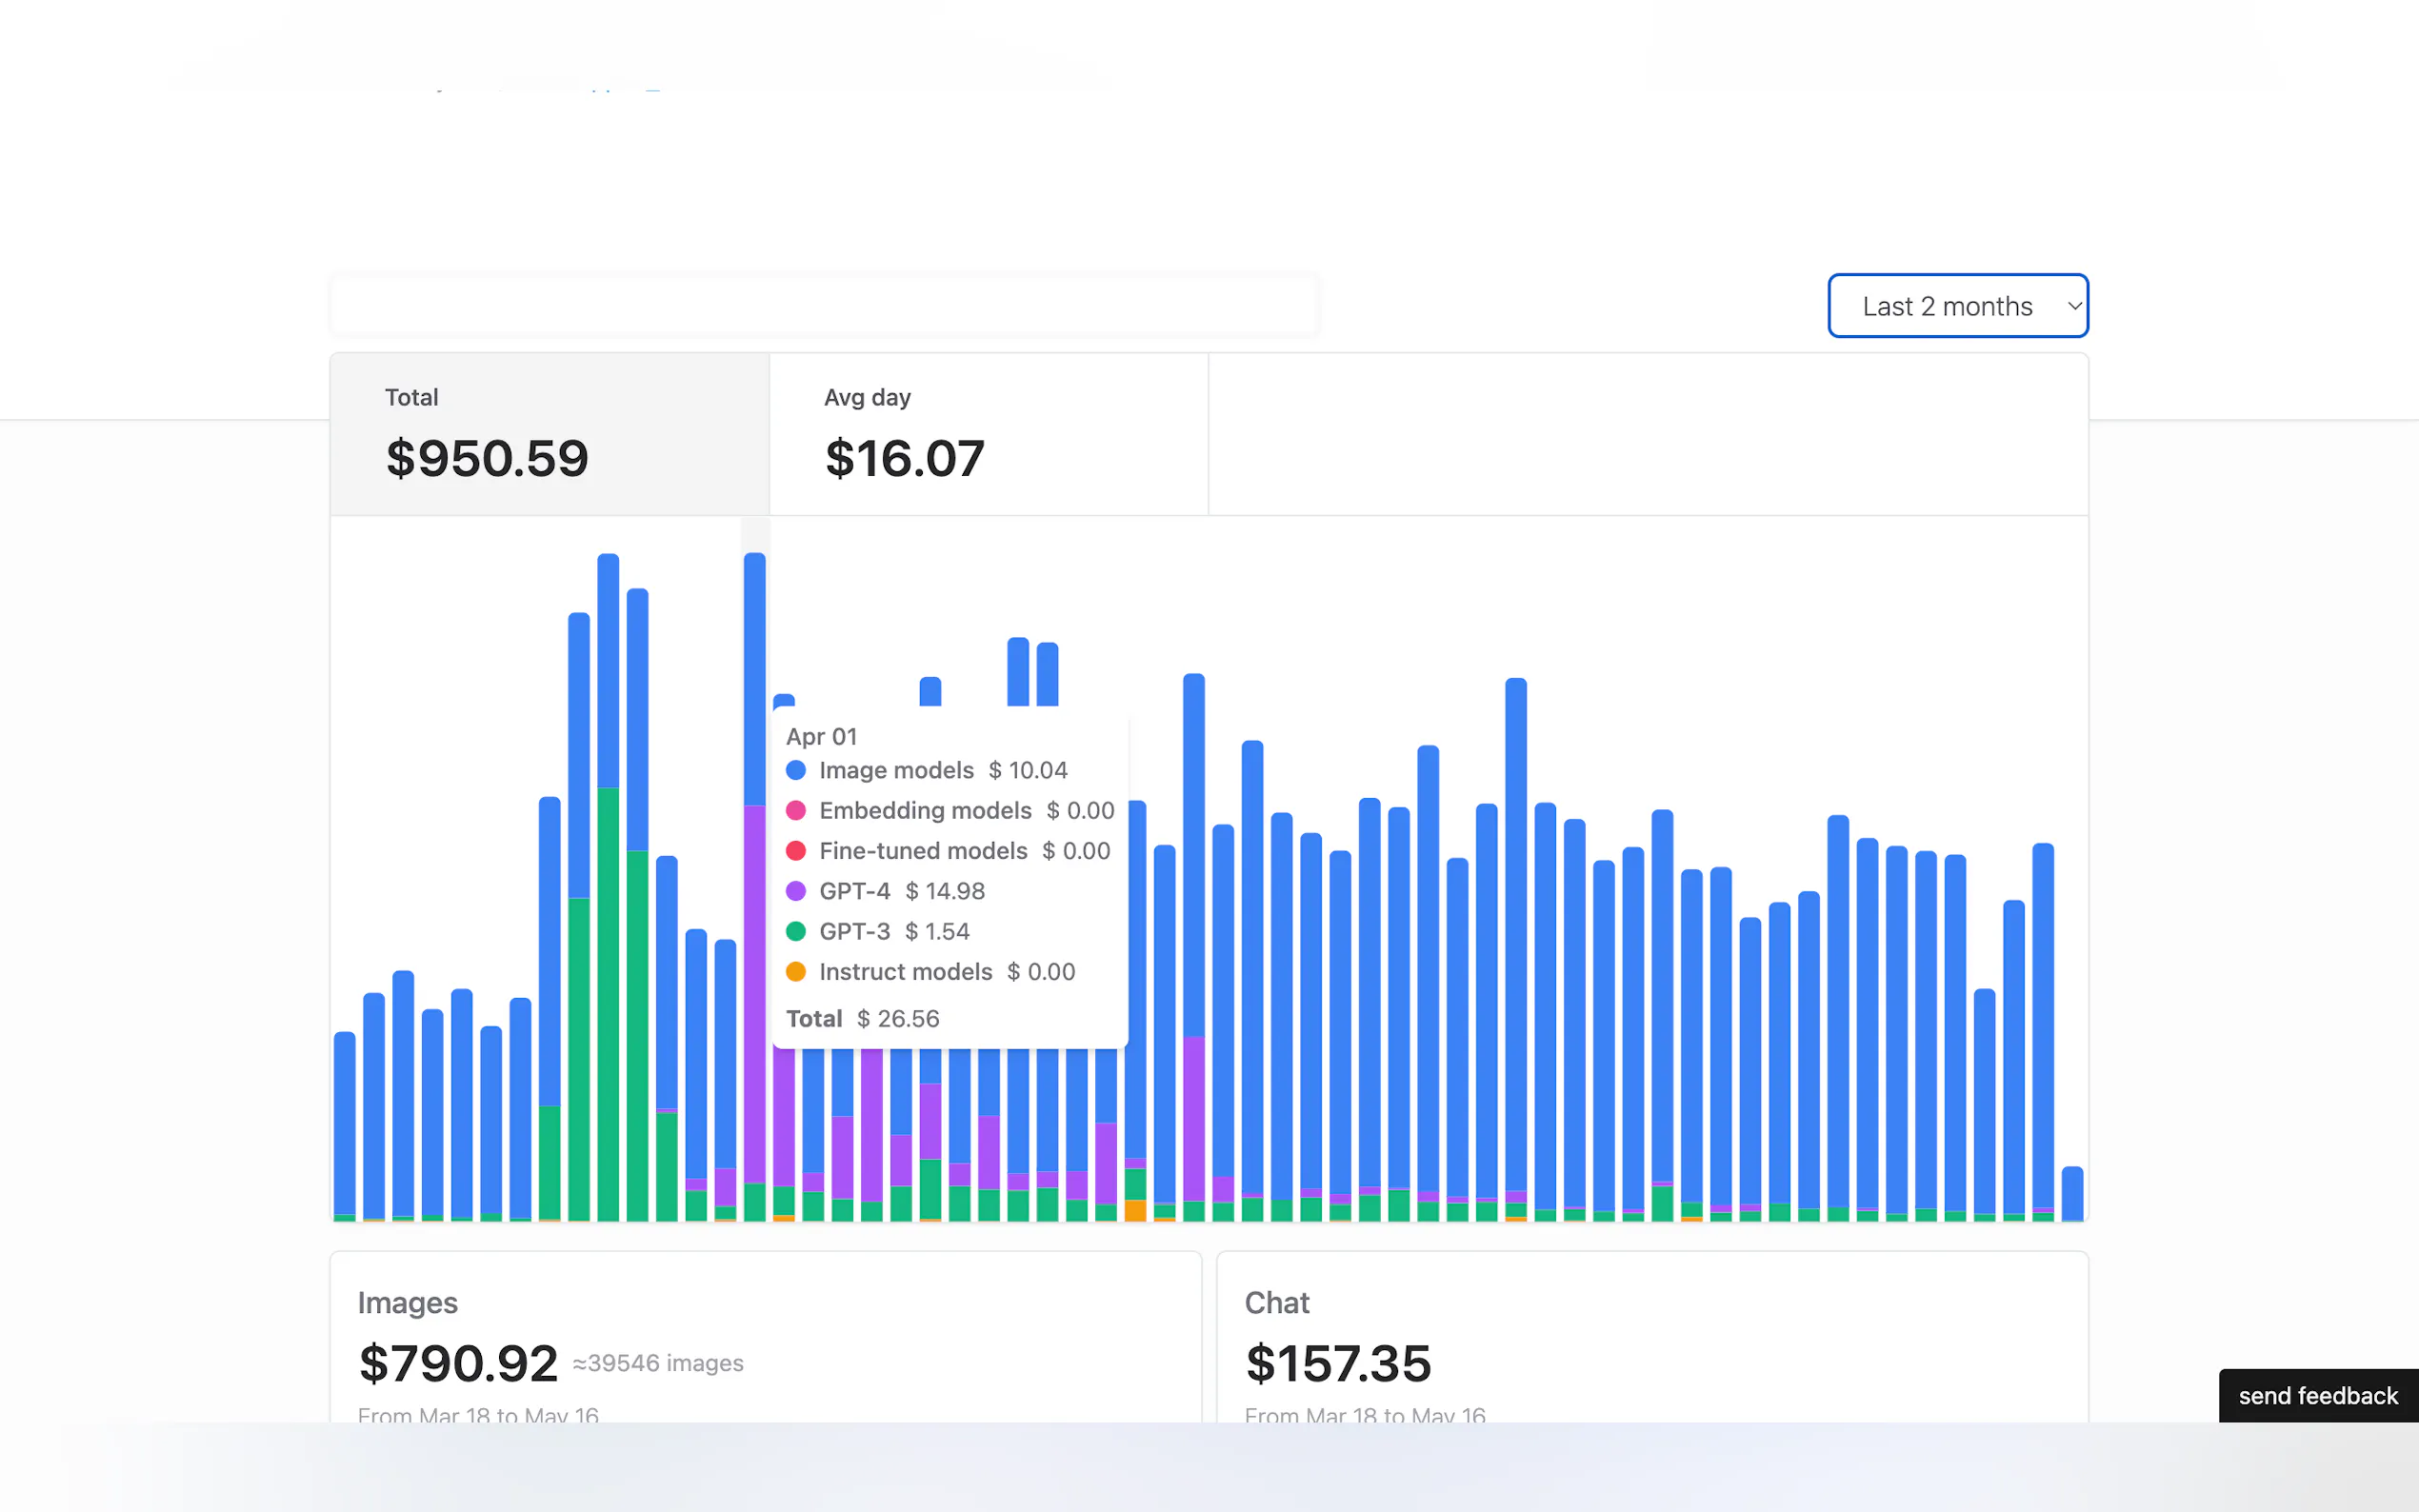
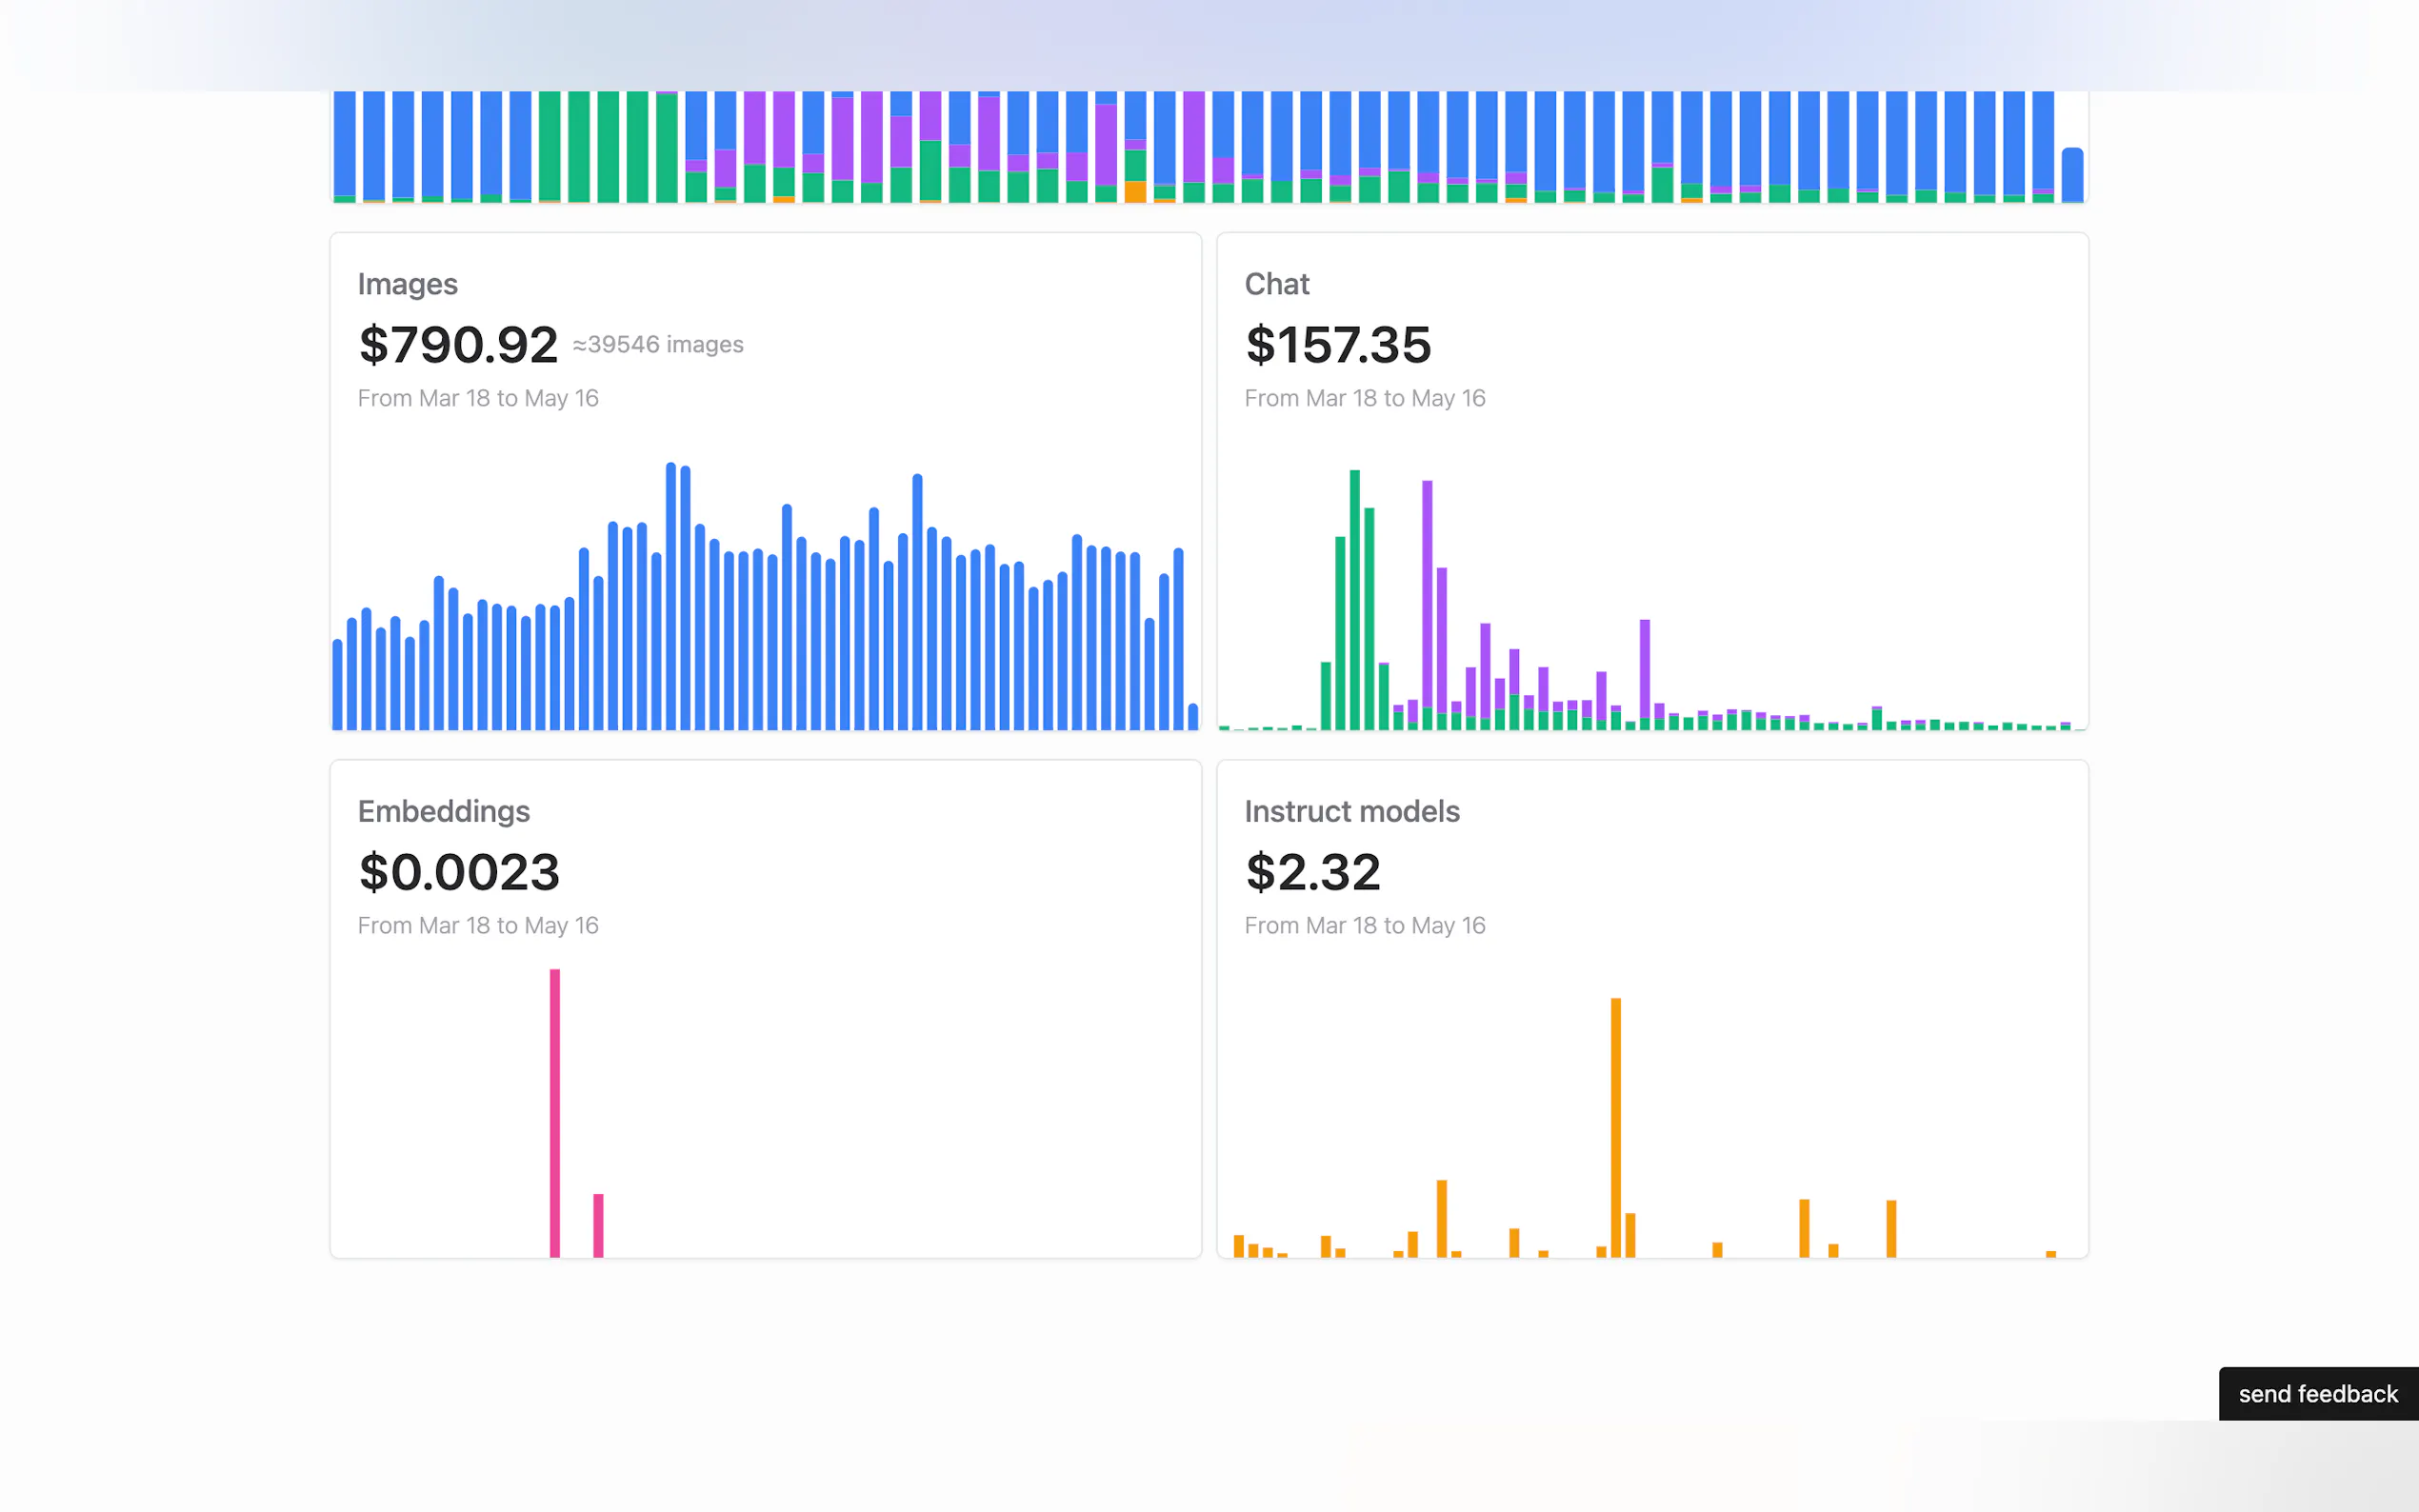
OpenAI Charts gives you a clear view of your OpenAI usage. Track and analyze spending across different models easily. Use these insights to optimize your resources. Make informed decisions based on your data. Save time and enhance efficiency in resource management. Boost your OpenAI experience with powerful visualization tools that help you stay on top of your usage trends and costs.
Top Features
- Visualize OpenAI usage with interactive charts.
- Track spending by model effortlessly.
- Gain insights to optimize resource allocation.
- User-friendly interface for easy navigation.
- Export data for detailed analysis.
