What is Chartonomics?
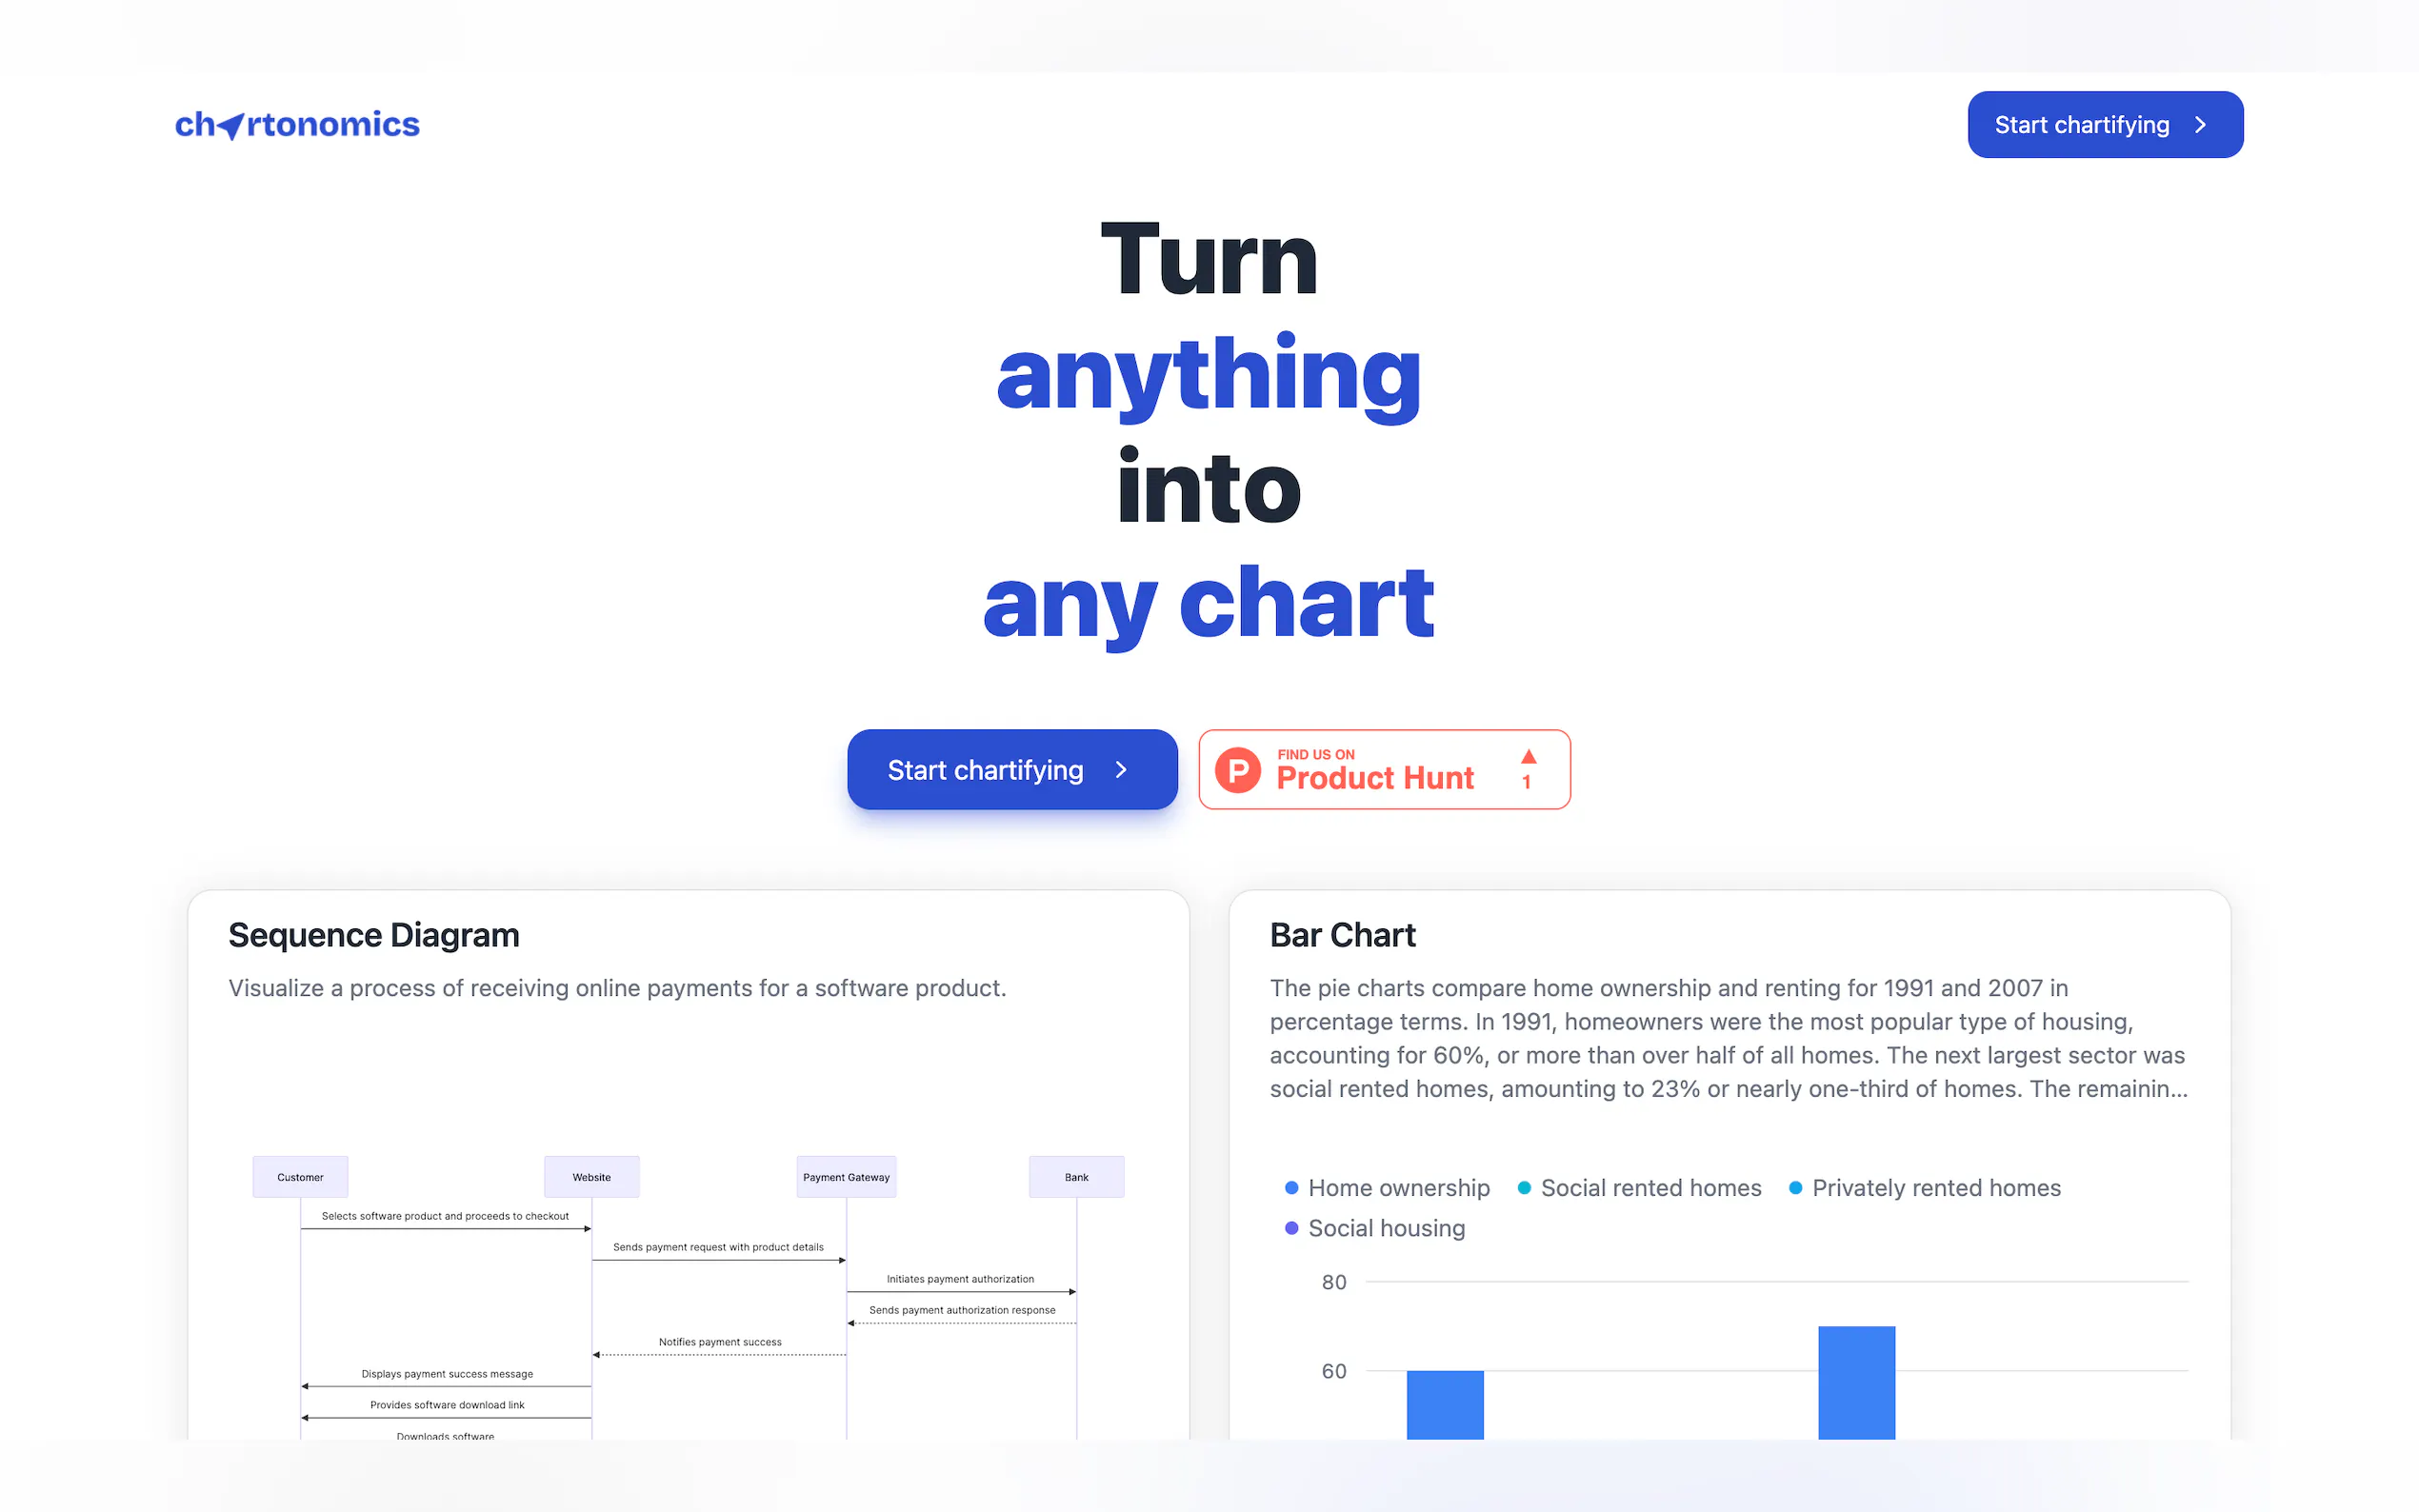
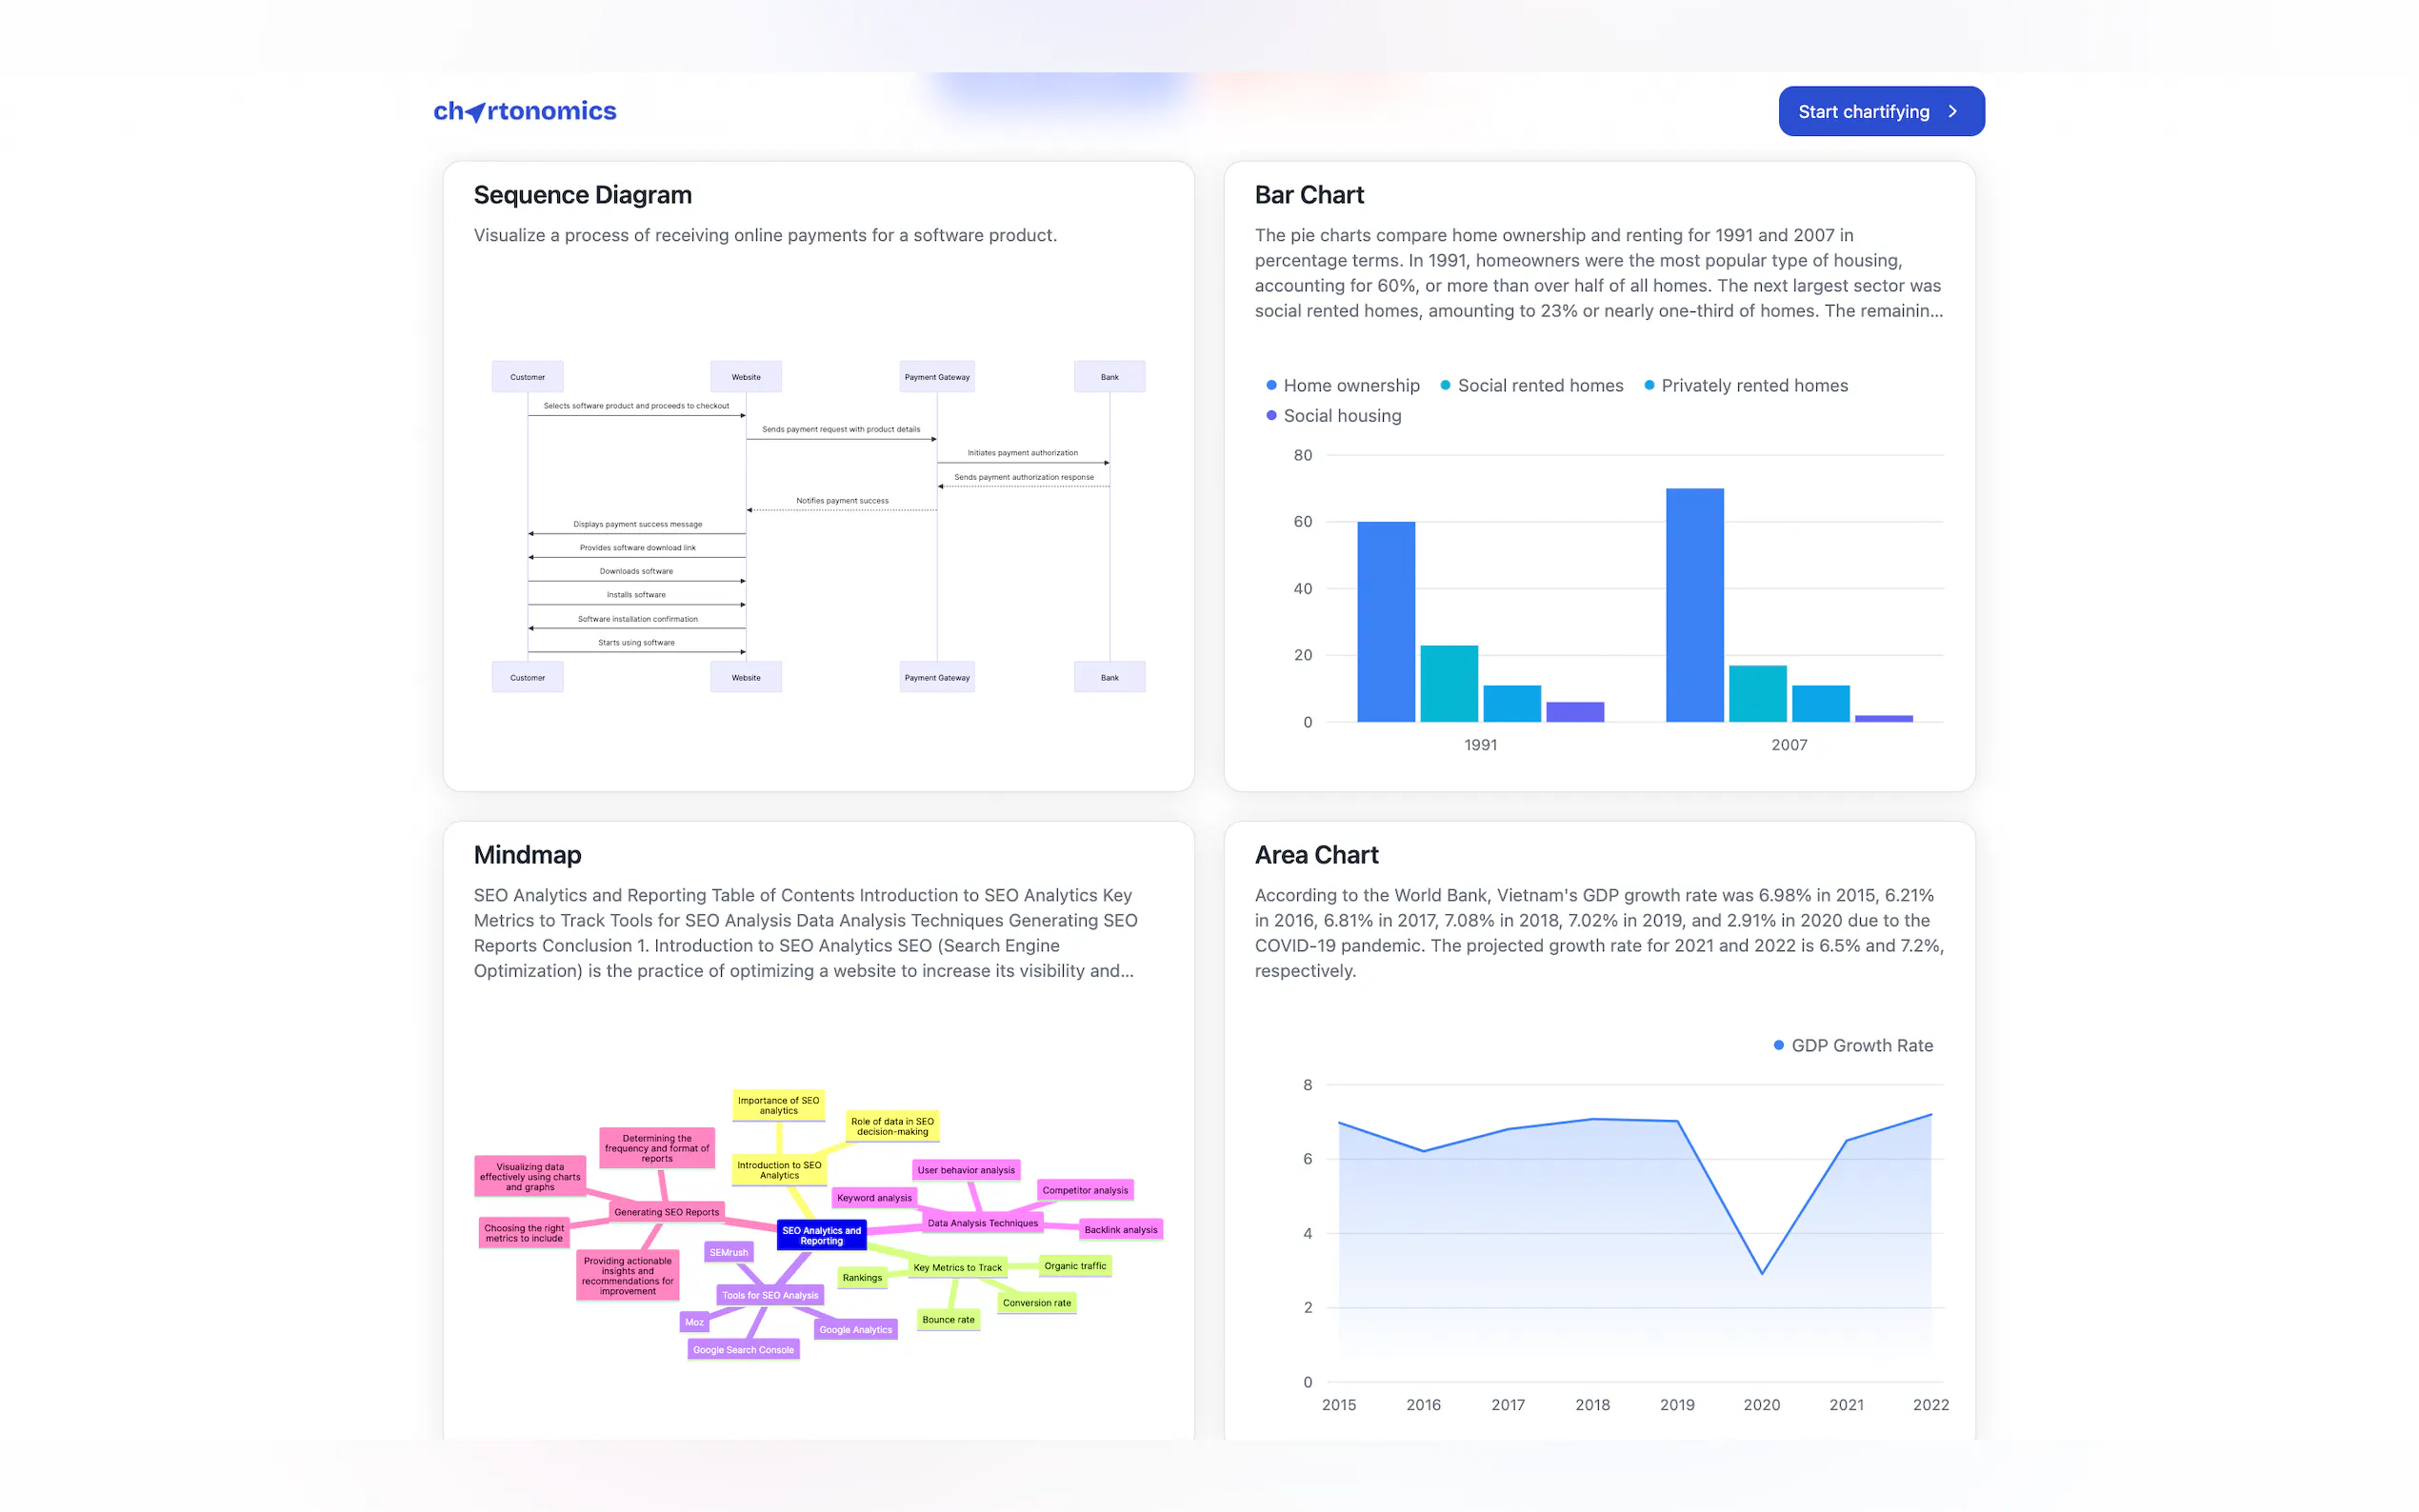
Chartonomics simplifies data visualization like never before. Just upload your messy information, and watch it transform into over 20 different charts. It’s perfect for anyone needing clarity from chaos. With a user-friendly interface, you can create impactful visuals to enhance communication and understanding. Whether for business or personal projects, Chartonomics is your go-to tool for effortless chart creation. Get started today and visualize your data easily!
Top Features
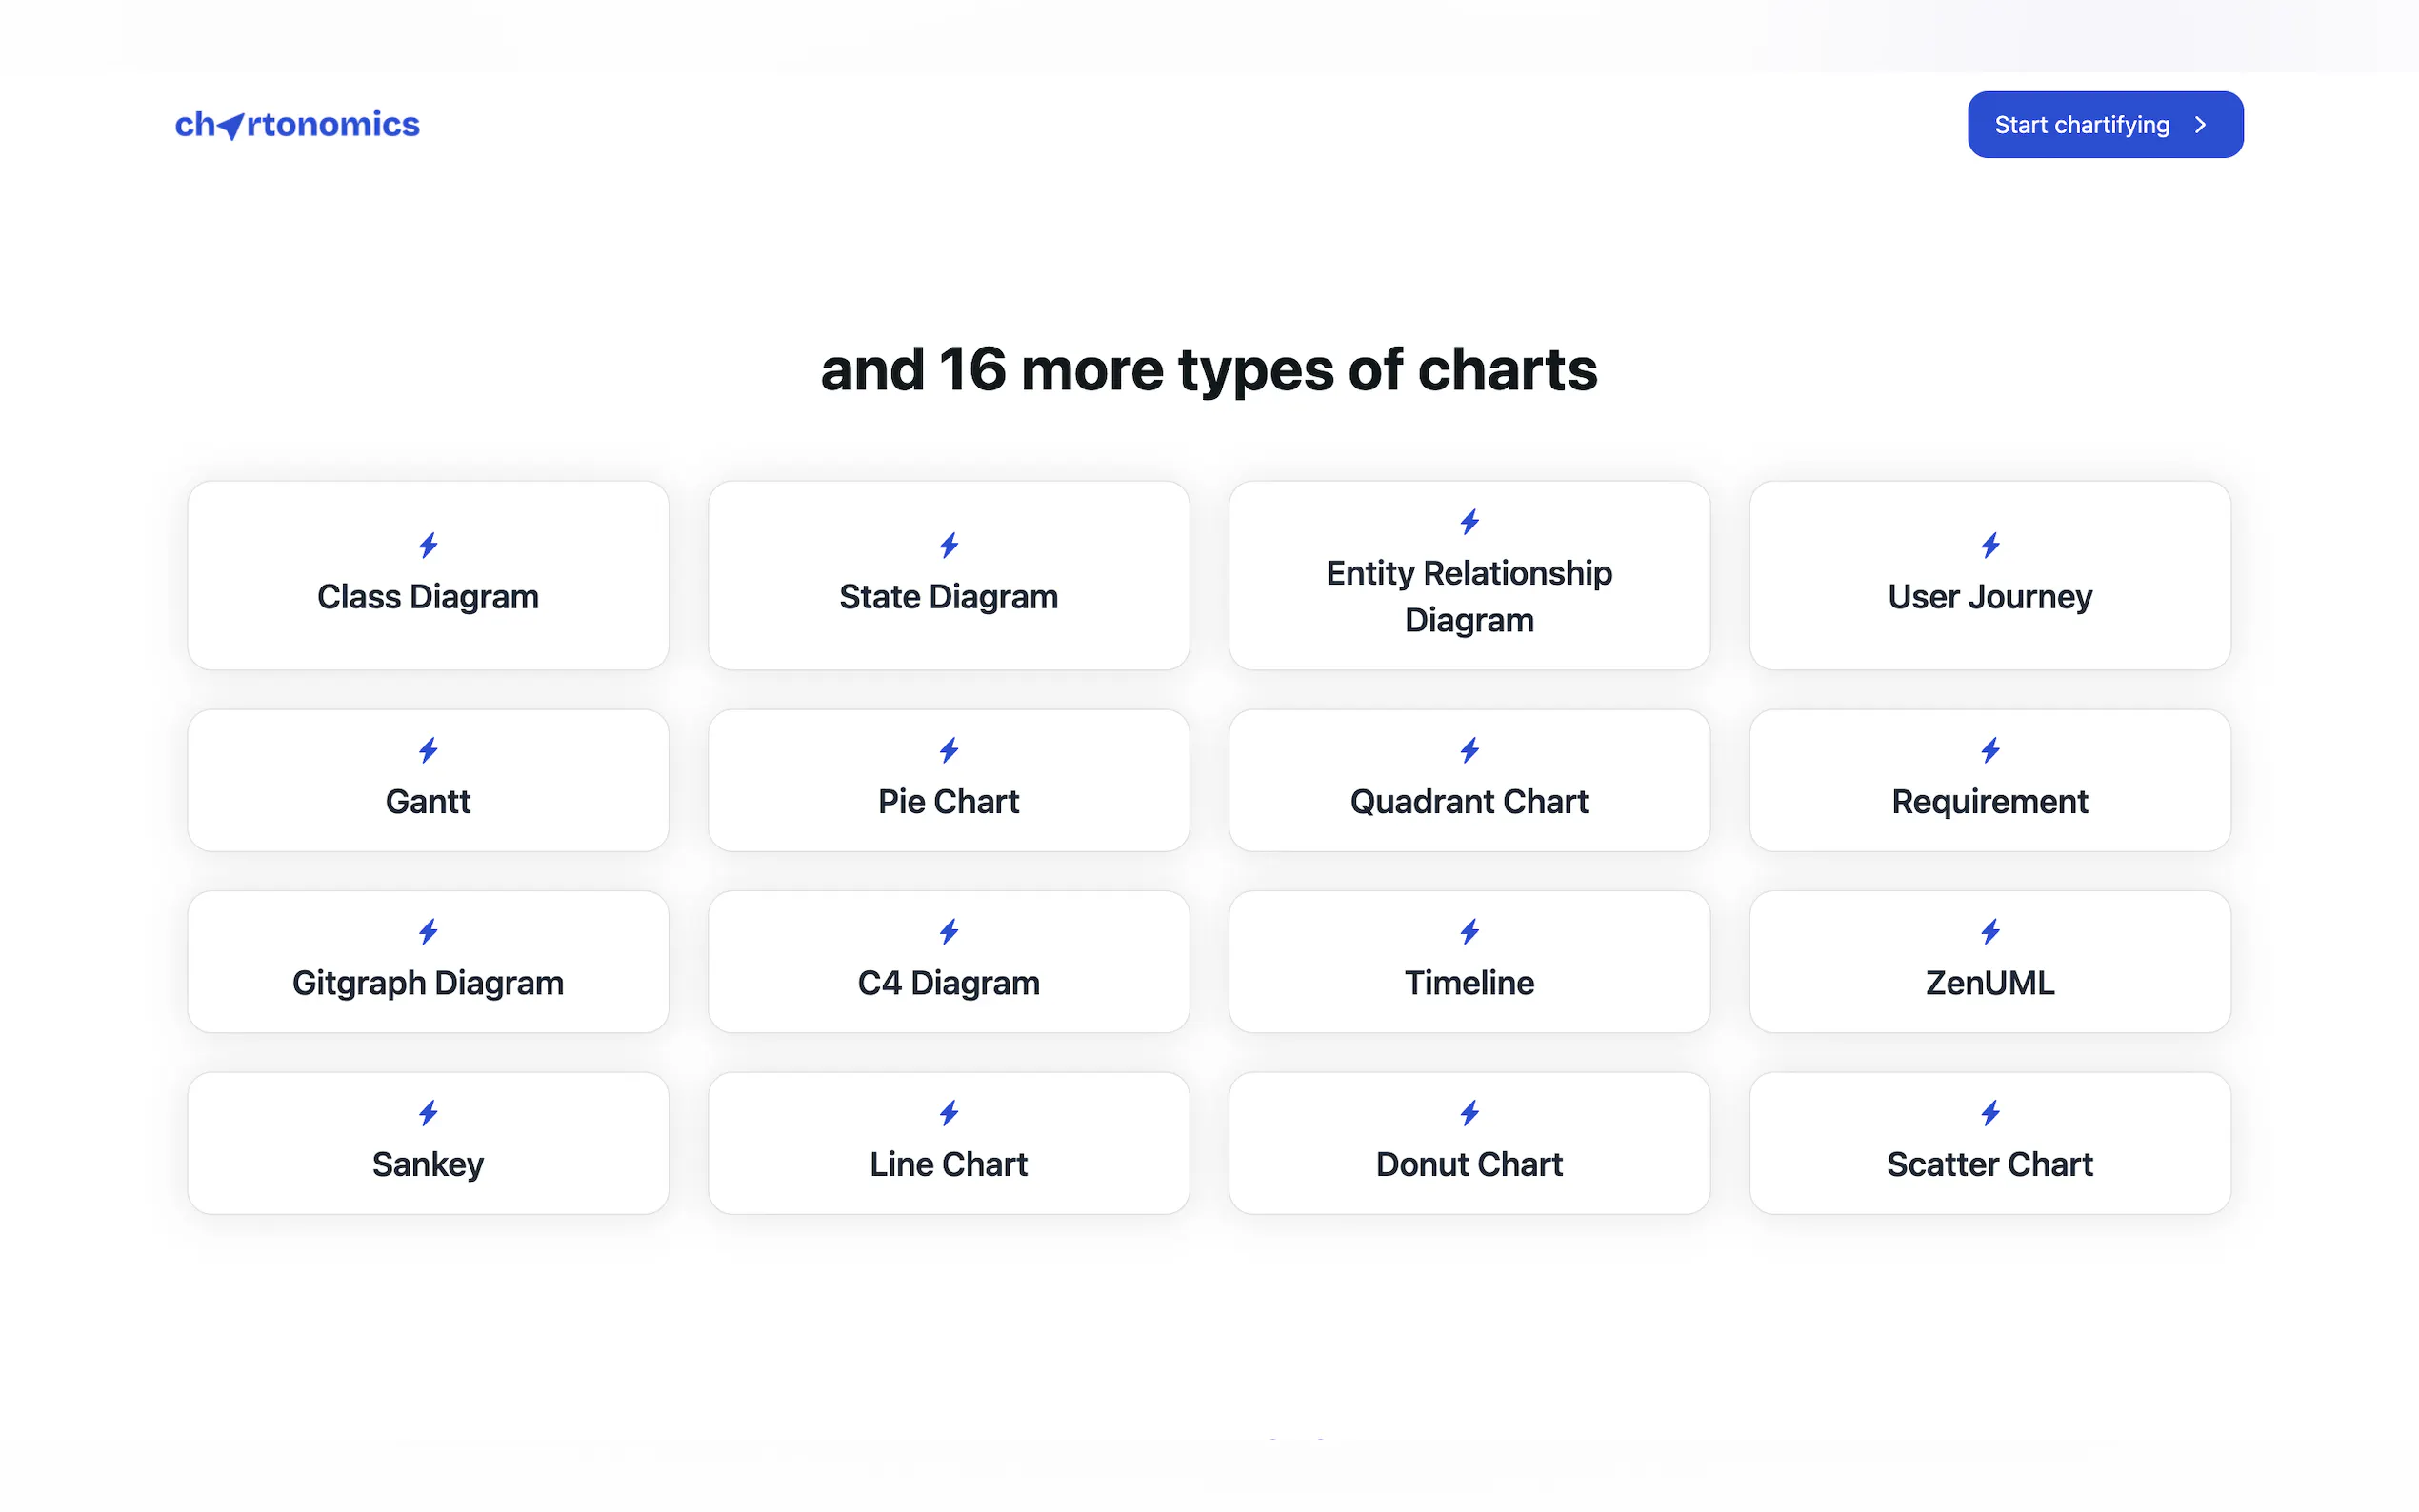
- Create 20+ chart types instantly.
- User-friendly interface for easy navigation.
- Transform messy data into clear visuals.
- One-click data upload and chart generation.
- Customizable charts to fit your needs.
- Ideal for business, education, and personal use.
- Access to future updates and support.
